Dashboard
Upon logging in, the first page you are directed to is the dashboard. Here at the dashboard you are informed with the following:
-
Total Resources
-
Total Cost (Last 30 Days)
-
Security Score
-
Active Alerts
-
Cloud Service Provider
-
Performance Overview
The image below depicts the representation of our Dashboard upon successful login.

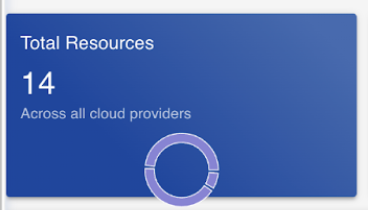
Total Resources
The Total Resources section gives you a cummilative sum of all your resources created within all of your configured Cloud Service Providers.
For example, if you have 3 resources created within AWS, 2 resources created within Microsoft Azure and 1 resource created within Linode, the Total Resources would be 6.
The image below is what you could expect on your dashboard.
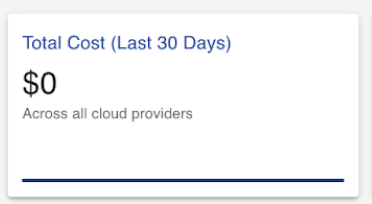
Total Cost (Last 30 Days)
The Total Cost section provides you with the cumilative cost spent by all resoruces using all your configured Cloud Service Providers.
For example, if you have $300 spent by resources created within AWS, $200 spent by resources created within Microsoft Azure and $100 spent by resource created within Linode, the Total Cost would be $600.
The image below is what you could expect on your dashboard.
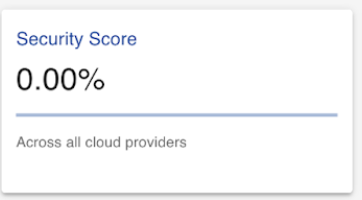
Security Score
The Security Score section provides you with a percentage out of 100 that evaluates all your resources created within each and every Cloud Service Provider against its best practiced and recommended measures.
The image below is what you could expect on your dashboard.
Active Alerts
The Active Alerts section provides you with the count of all your active alerts generated for all your resources within every Cloud Service Provider. When each resource within every Cloud Service Provider is evaluated against its best practiced and recommended measures, alerts are generated when these resources fail to align with its best practices and recommended measures.
The image below is what you could expect on your dashboard.
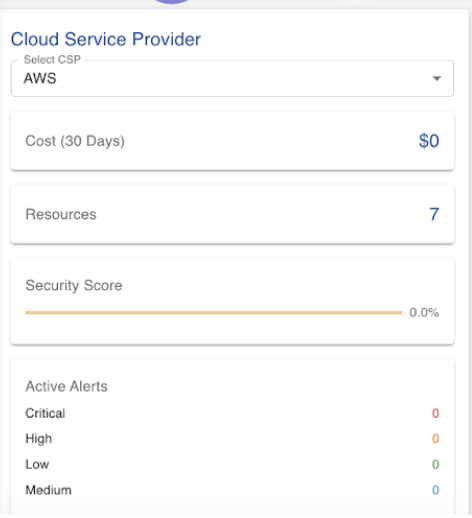
Cloud Service Provider
The Cloud Service Provider section allows you to perform analysis such as Total Resources, Total Cost (Last 30 Days), Security Score, Active Alerts for the selected Cloud Service Provider using the dropdown option. Alongside such options, Quick Actions are allowed as well.
The image below is what you could expect on your dashboard.
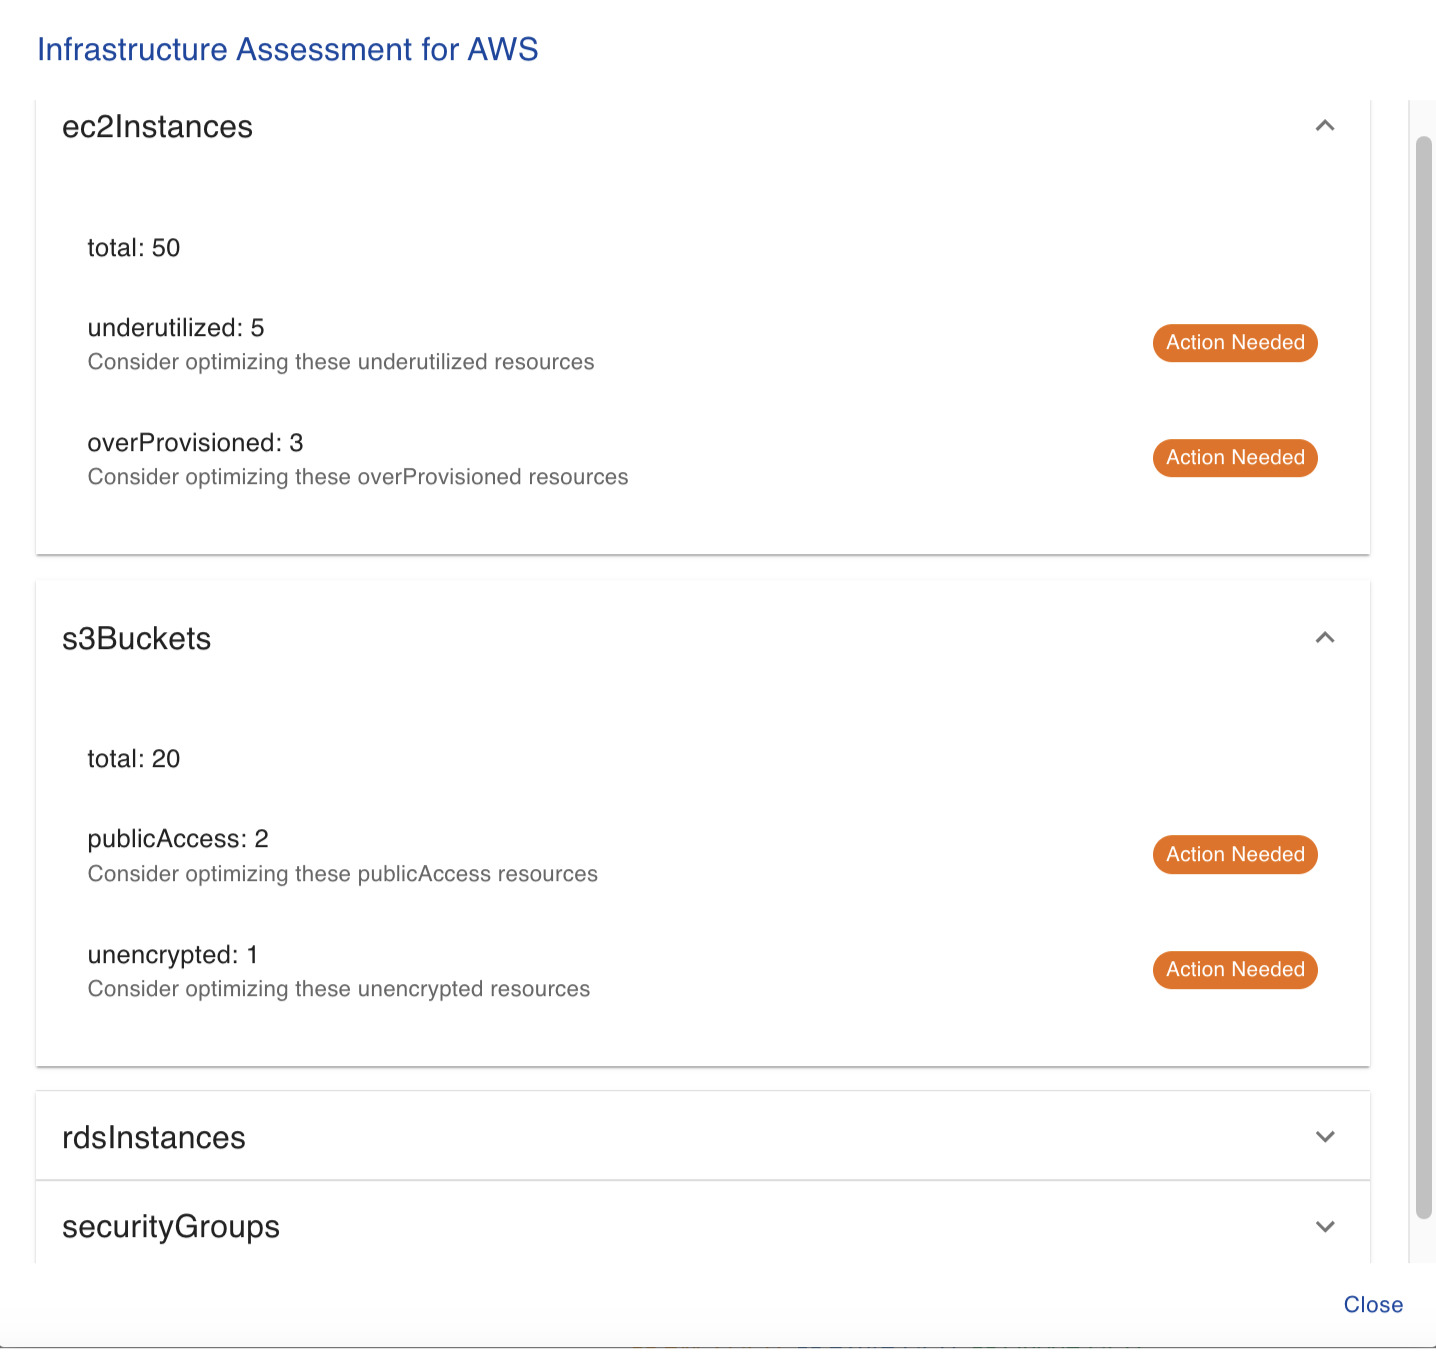
Quick Actions
The Infra Assesment Quick Action generates a report of all the resources within the Cloud Service Provider and if any actions are required to improve current cloud practices "Action Needed" is displayed beside the resource to optmise your current infrastructure. Otherwise, "No Action is Required" is displayed beside the resource.
The image below is what you could expect on your dashboard.
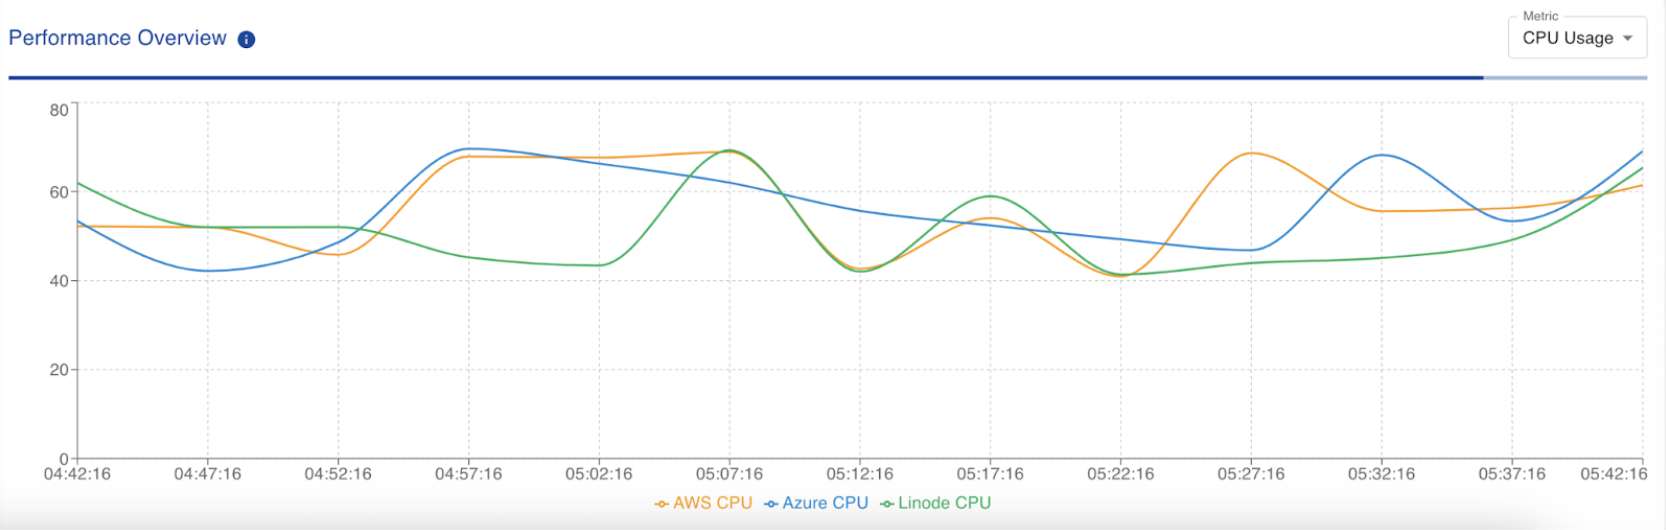
Performance Overview
The Performance Overview section plots a graph based for each Cloud Service Provider on the selected metric in the dropdown menu as shown below. The dropdown menu allows you to choose between CPU Usage, Memory Usage, Network Usage and Latency. The plotted graph serves as a comparison between all the configured Cloud Service Providers which allows you to analyise between Cloud Service Providers on your selected metirc.
The image below is what you could expect on your dashboard.