Anomaly Detection
The Anomaly Detection feature service alerts you based on Real-Time Anomaly Detection. The Anomaly Detection dashboard provides insights based on total number of anomalies found along with the breakdown of high severity anomalies and medium severity anomalities.
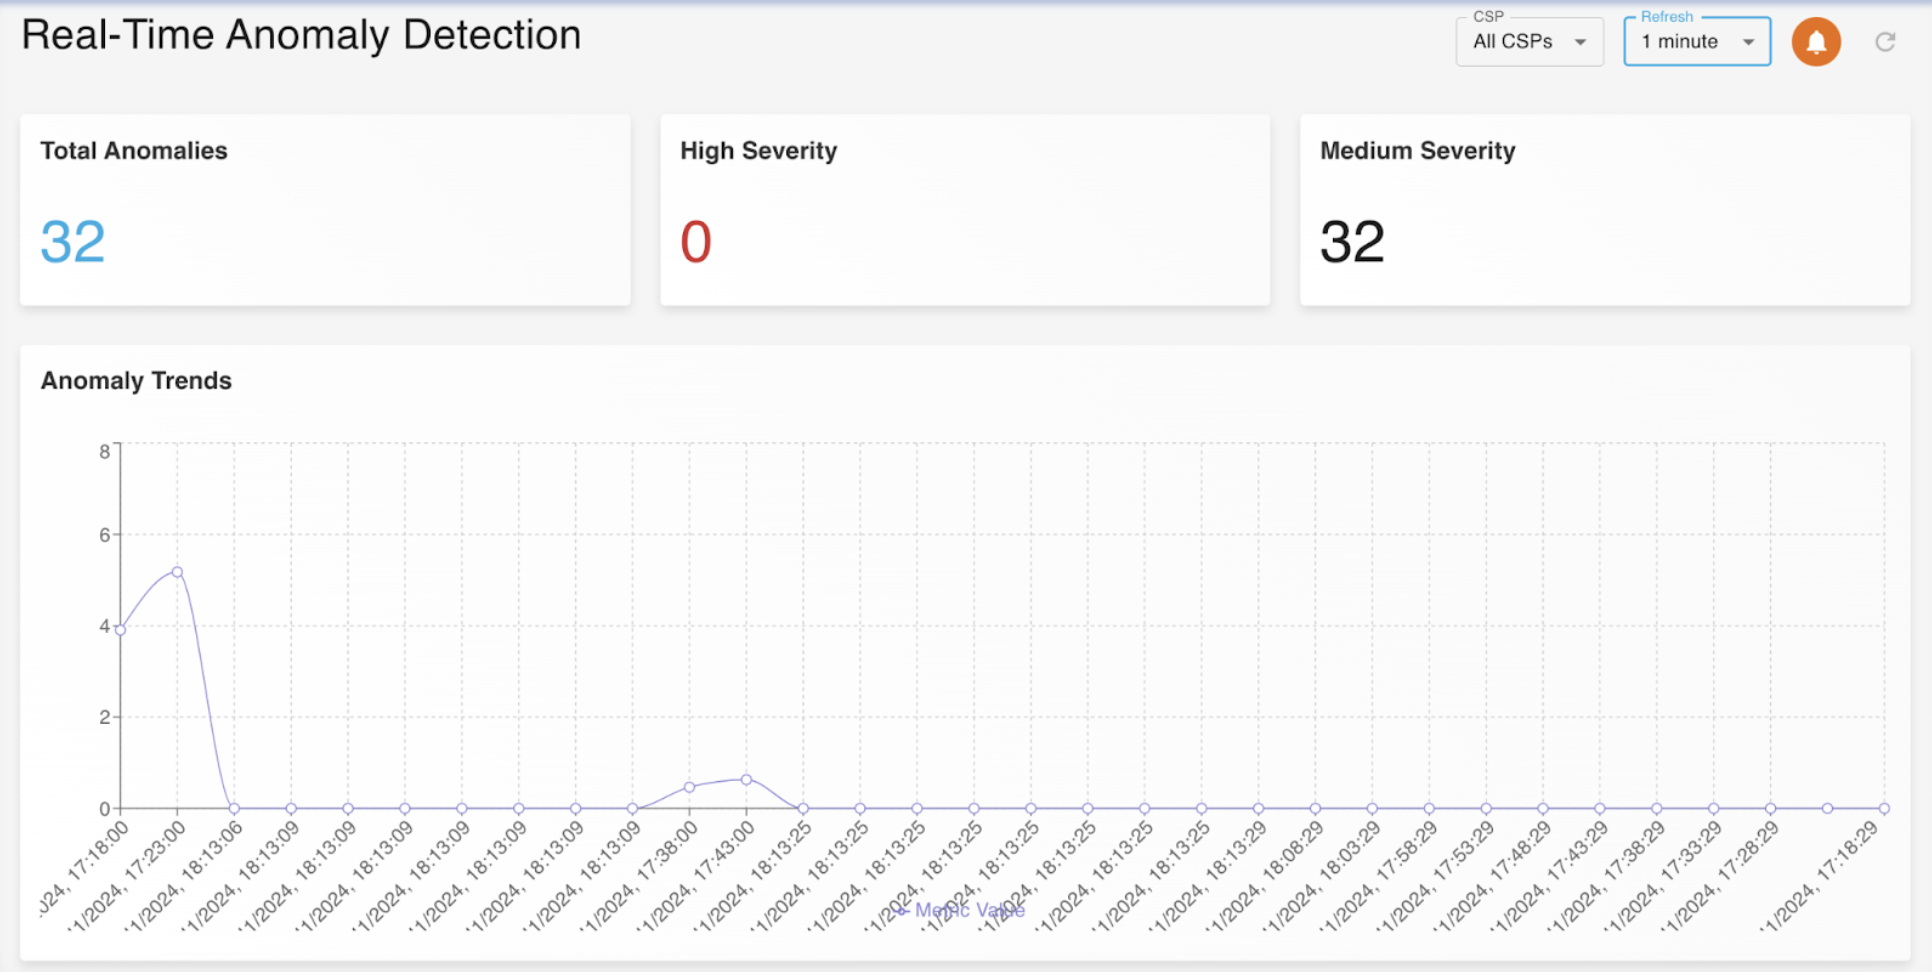
Along with numerical insights, we also provide you with graphical insights that show exactly when the anomalies took place and how many anomalies took place.
The Real-Time Anomaly Detection Dashboard is represented by the image below
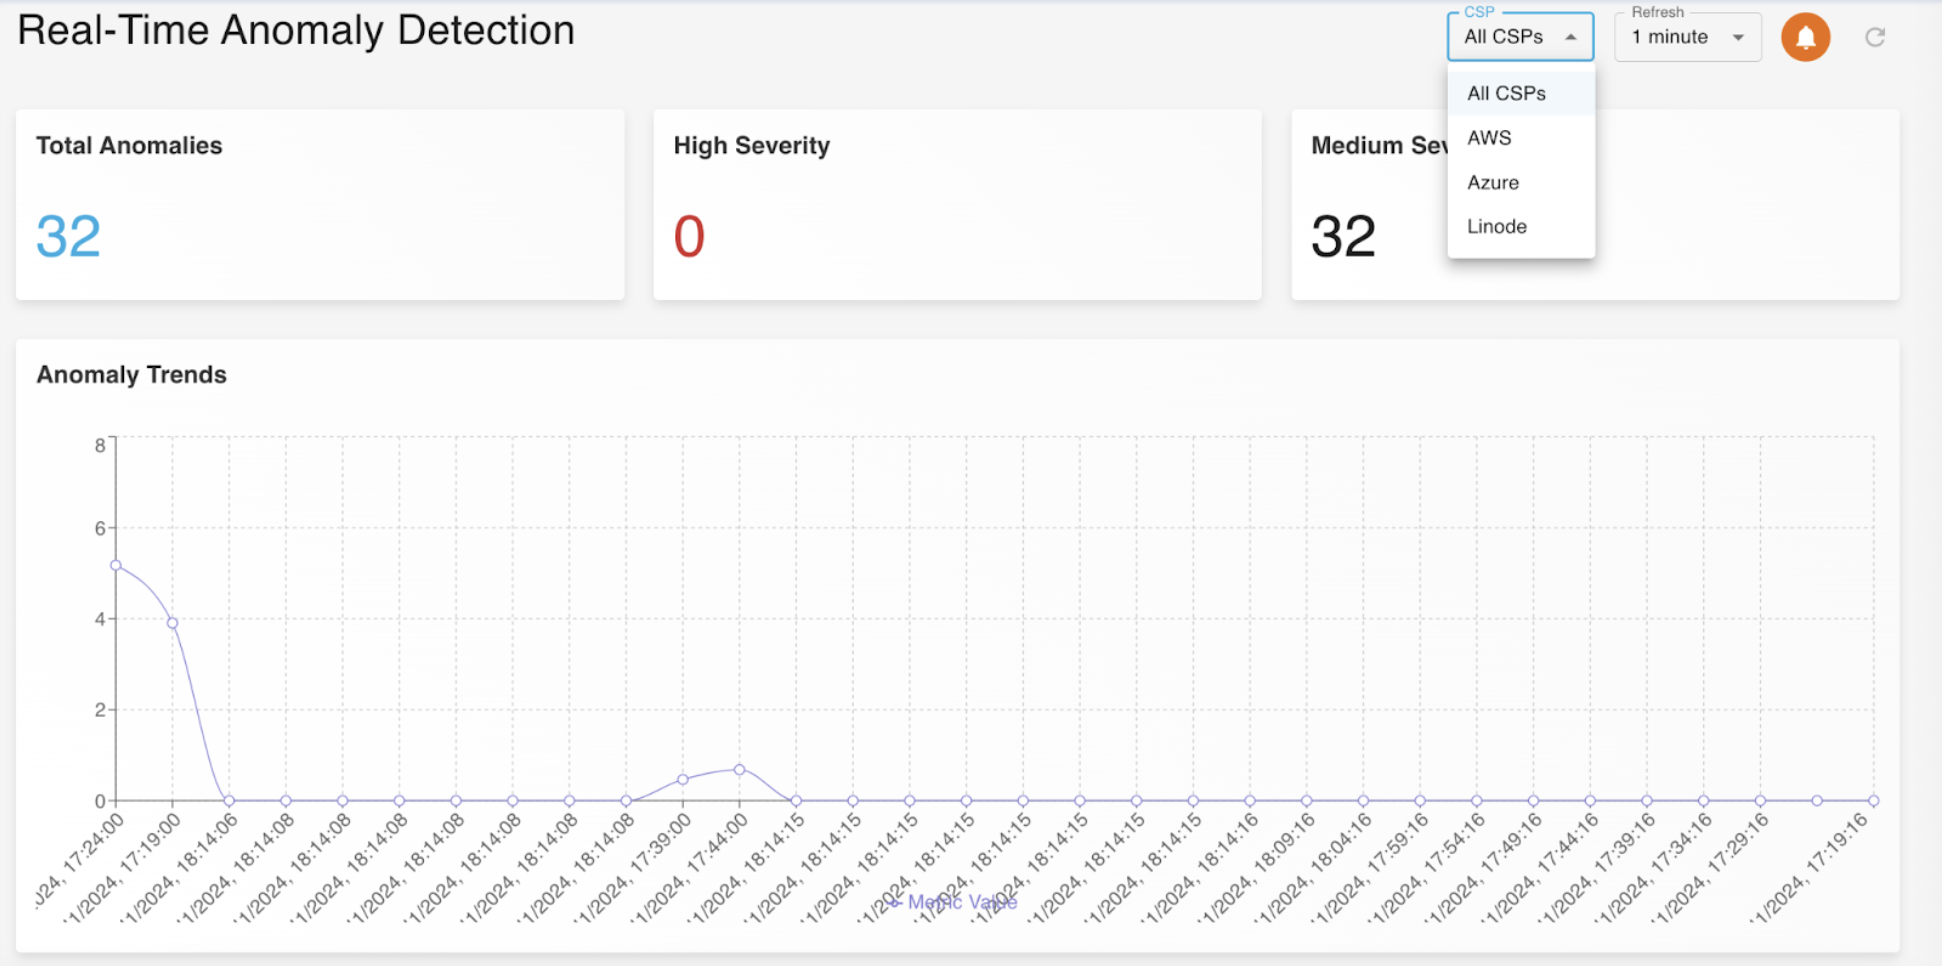
The Total Anomalies, High Severity anamolies and Low Severity anamolies, are all produced based on chosen CSP option. You may either choose to see anomalies of every CSP or any single CSP at the given moment using the CSP dropdown menu. The available options for the CSP dropdown menu are shown below
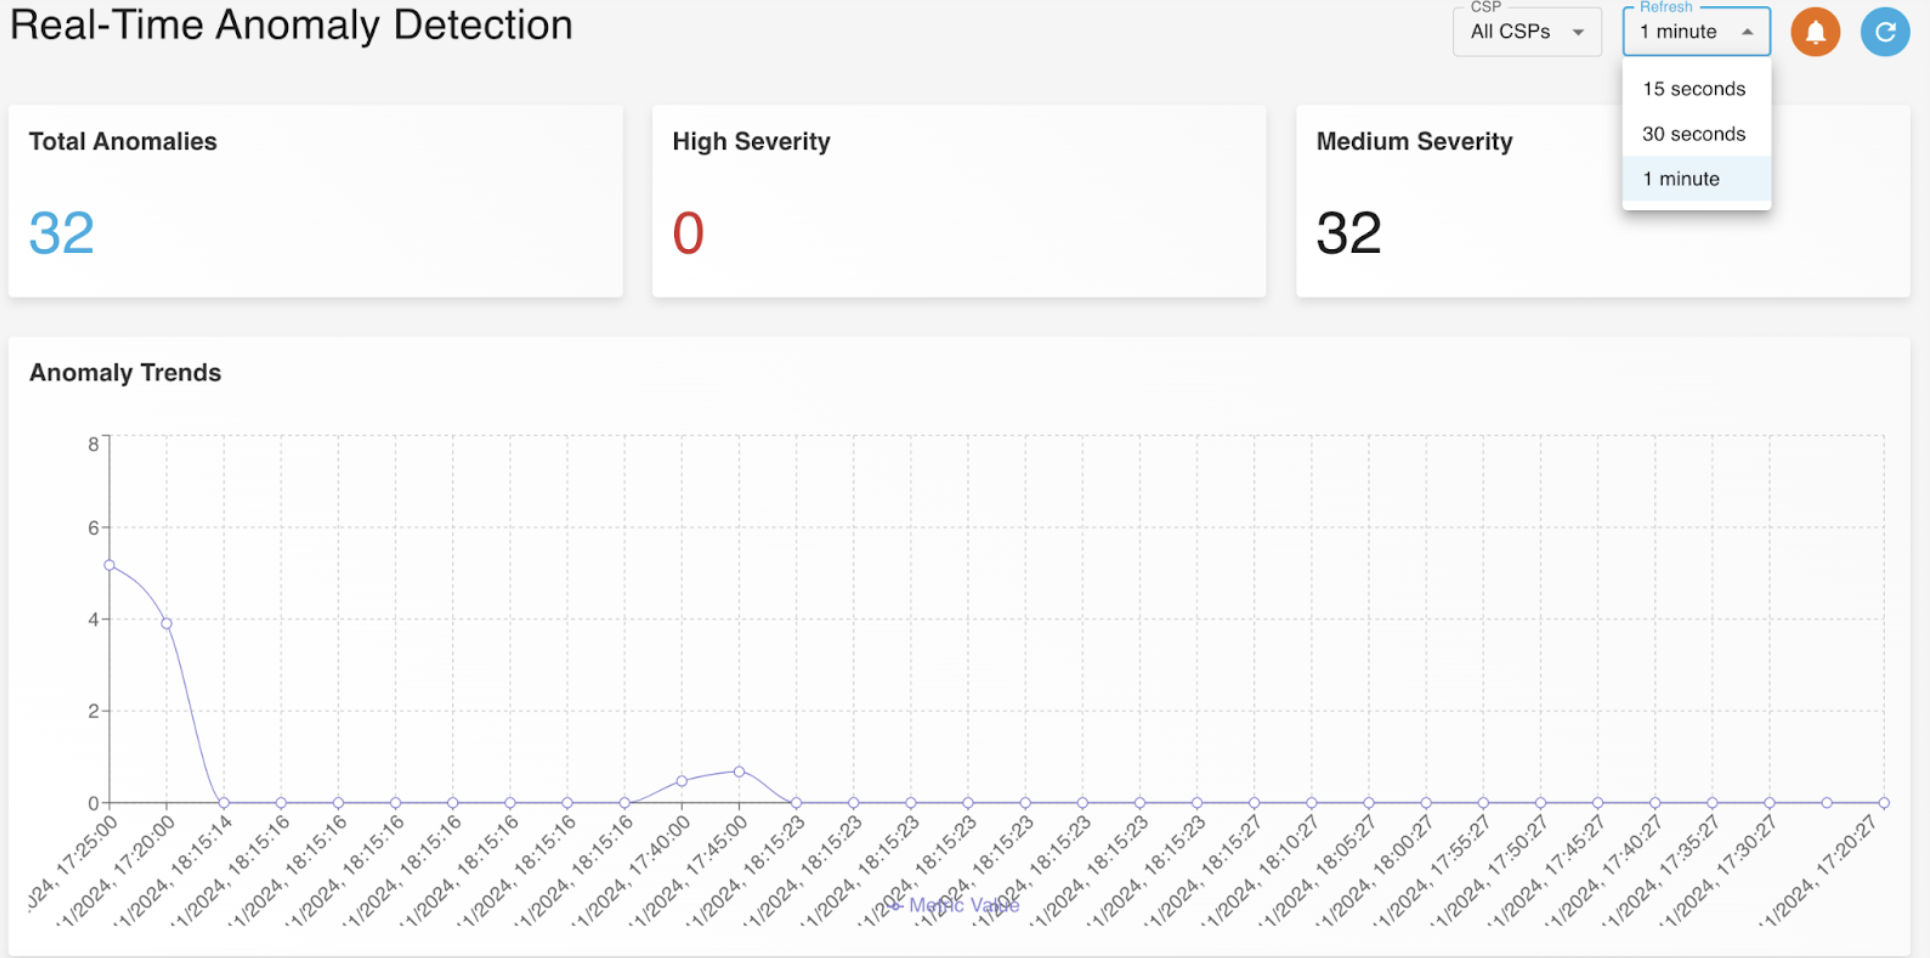
Since we are motivated to provide you with Real-Time Anomaly Detection, we have minimise the refresh rate as low and efficent as possible. You may select your desired refresh rate using the dropdown menu. The available options for the refresh rate dropdown menu are shown below.
Alerts
We strive to provide our clients with the best and most convenient features. This motive of ours motivated us to not only display all anomalies in the Anomaly Dashboard but also send them to your Email, alerting you everytime there is any detected anomaly.
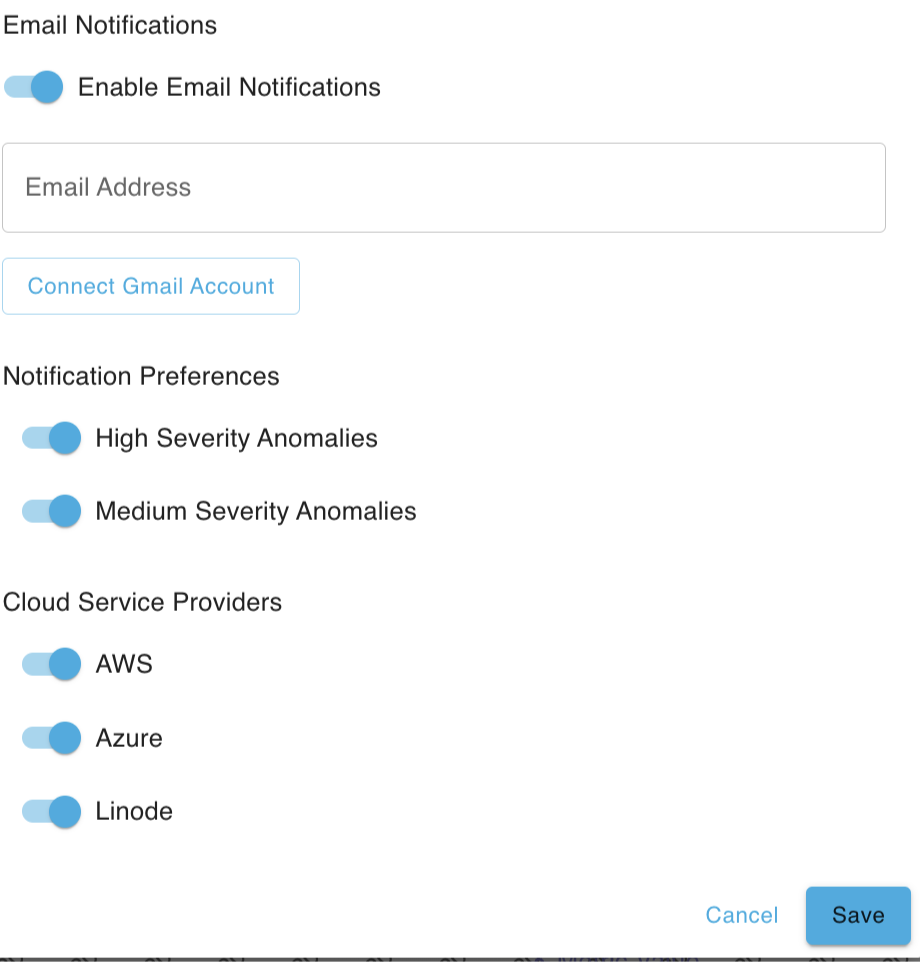
To configure our Email anomaly alert system
-
Click on the orange bell icon in the top right corner
-
Enter your Email account
-
Click on "Connect Gmail Account"
-
Add your notification preferences
-
Choose your CSPs that you would like to configure this Email anomaly alert system
-
Upon confirming all entered details, click on "Save" to start recieving alert notifications from the next instant.
The below image shows the Email anomaly alert system configuration menu.
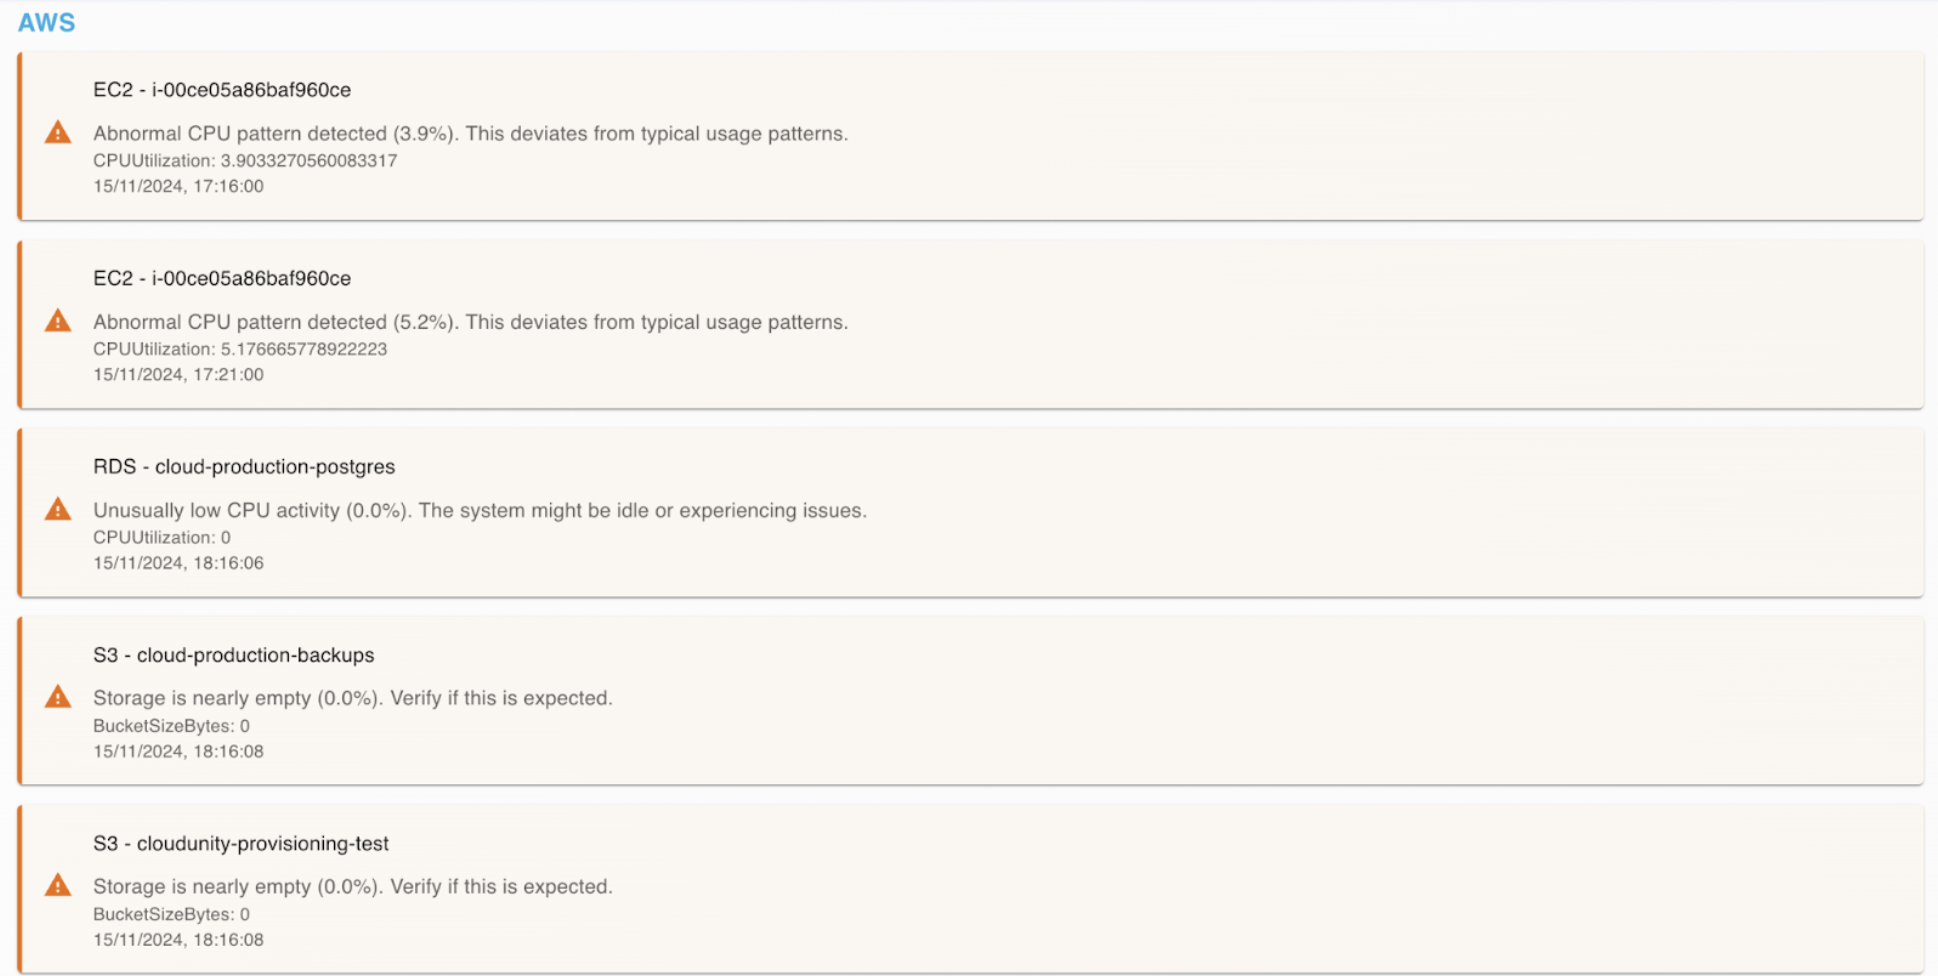
Anomaly Description
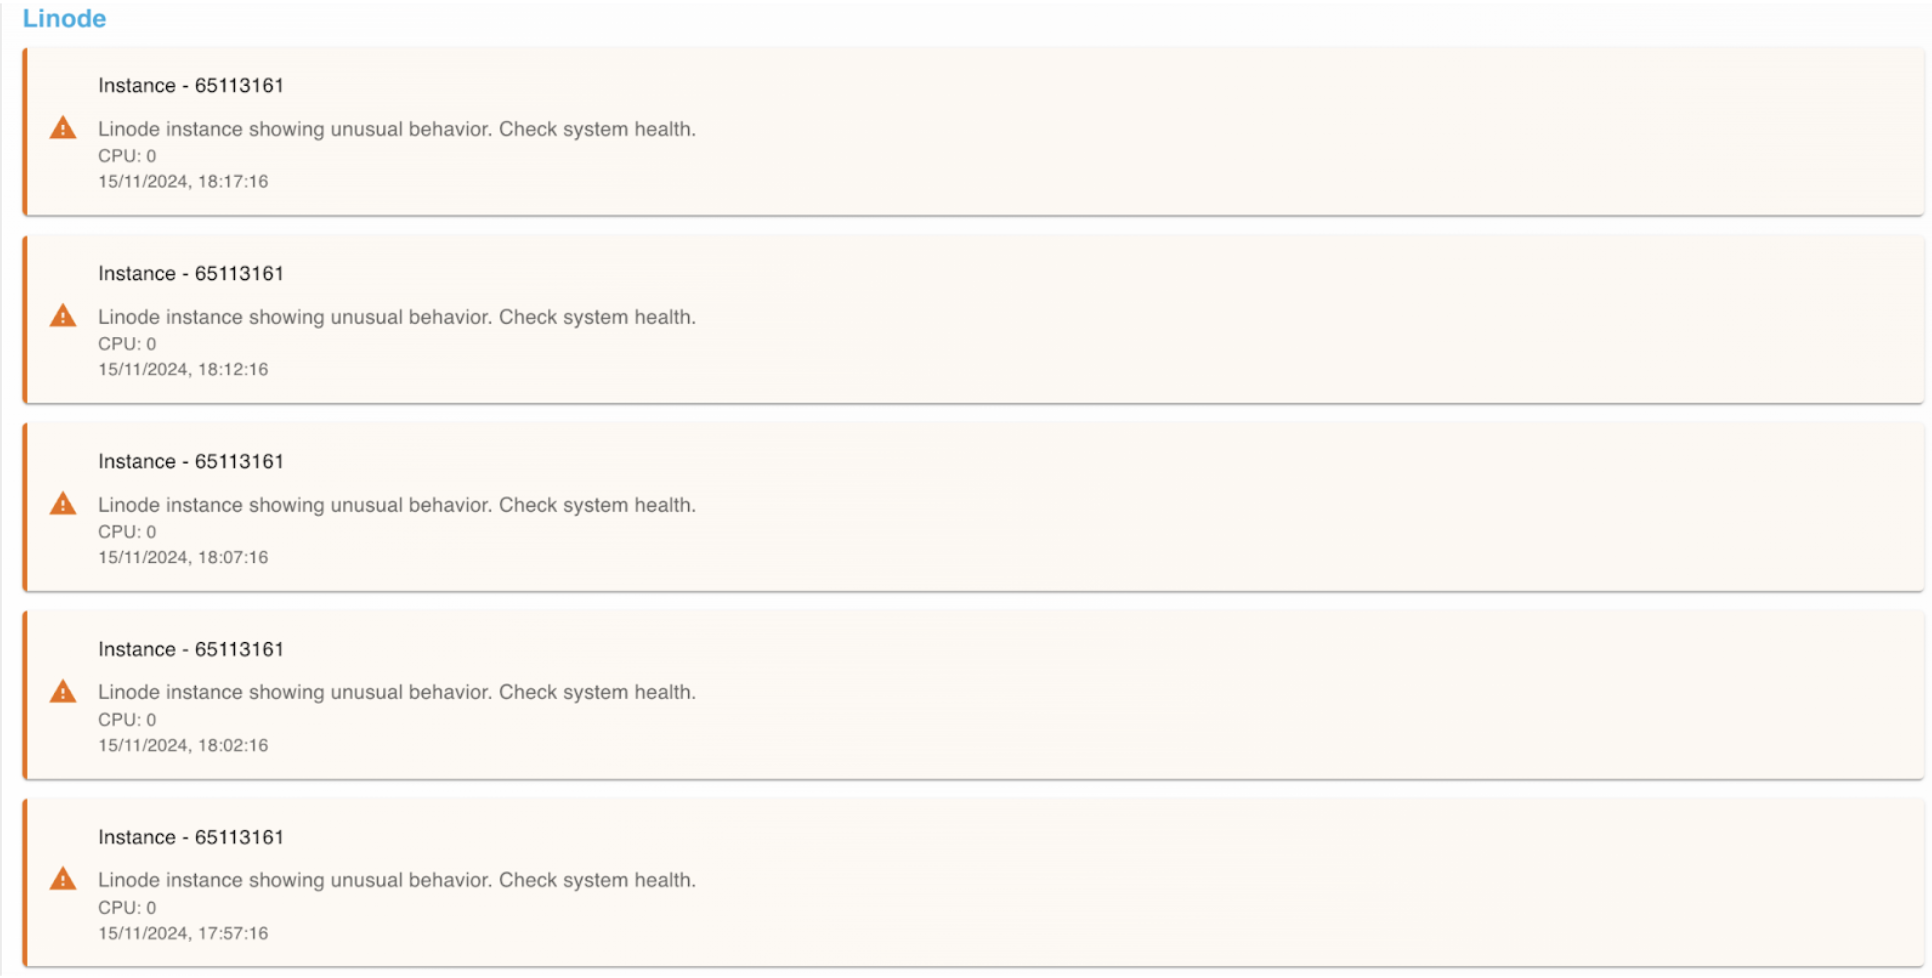
Below the Anomaly Trends section, the description of each anomaly is given in a categorised manner for each CSP.
The image below shows the Anomaly Description of AWS
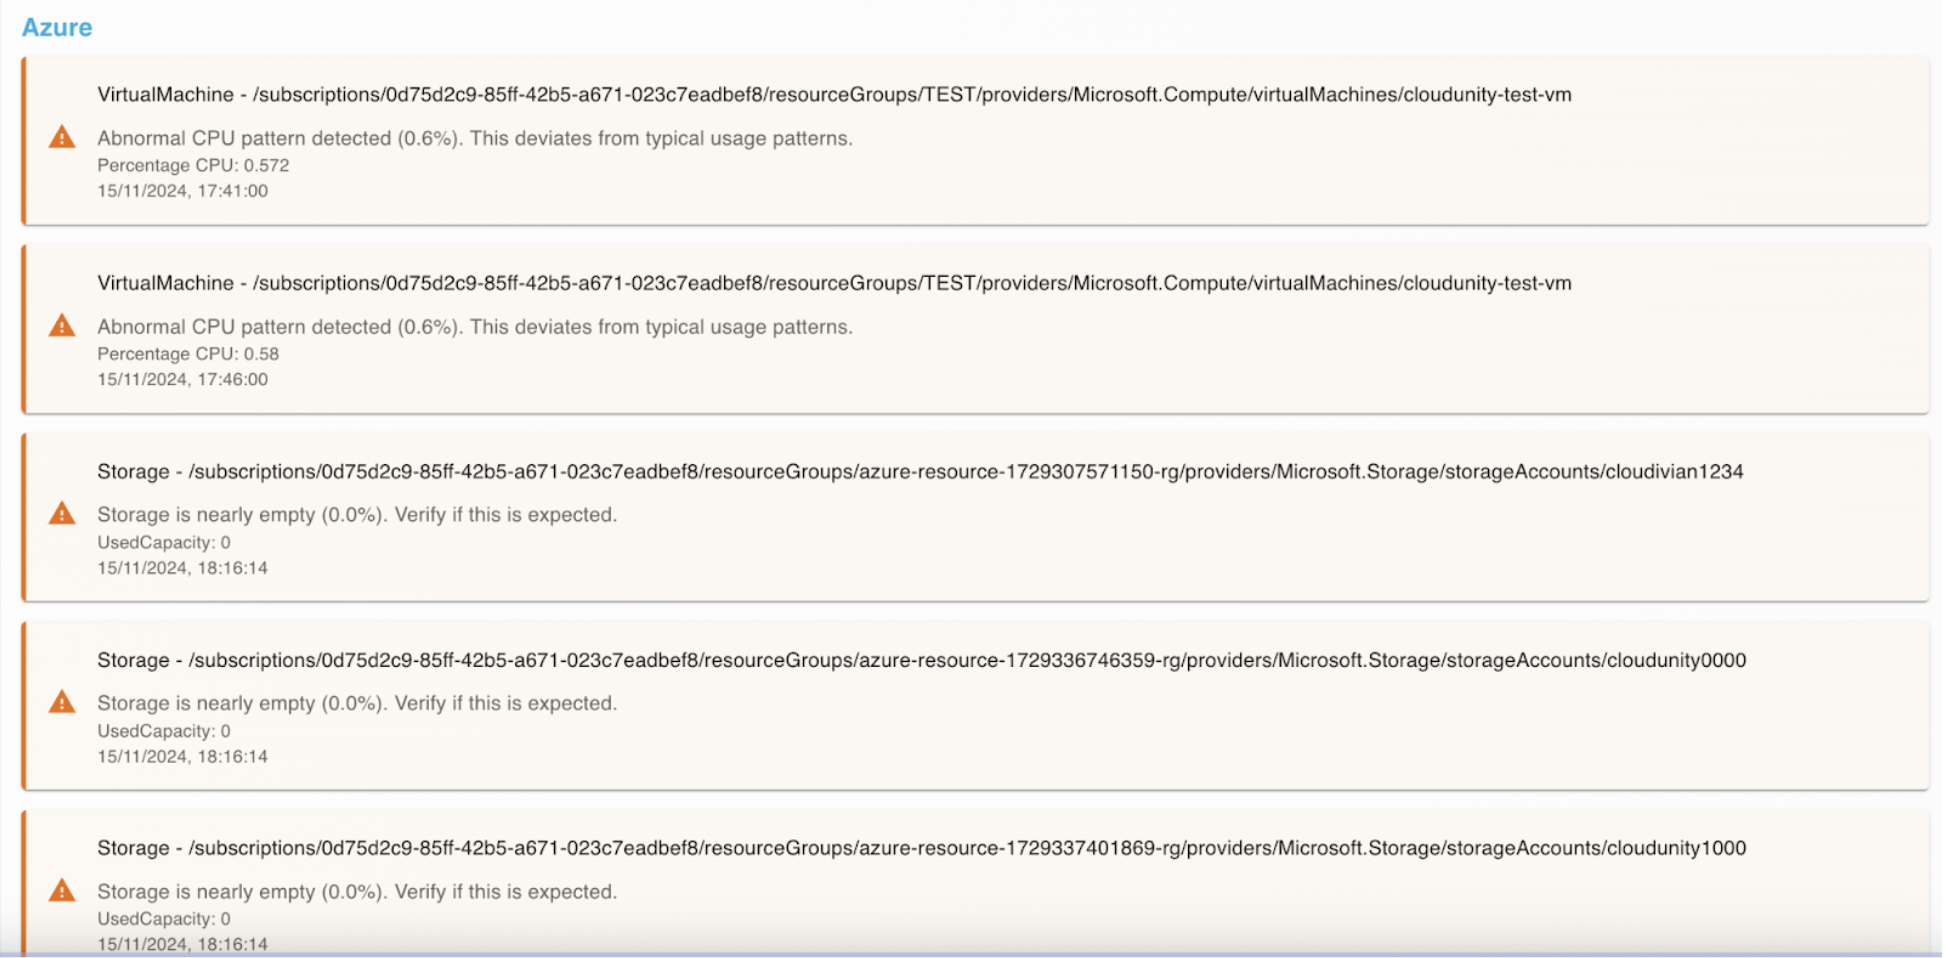
The image below shows the Anomaly Description of Azure
The image below shows the Anomaly Description of Linode